How to install the ELK Stack on Ubuntu for pfSense
So, on a whim I googled syslog + pfsense, and I saw some images of some nice dashboards (Kibana) for the firewall logs from PFSense. The tutorials I found did not tell me exactly how this all works, particularly how Elasticsearch, Logstash and Kibana works together.
These instructions will tell you what I have learned and how I installed the Elastic Stack (Elasticsearch, Logstash, Kibana, Beats and SHIELD) on Ubuntu with encrypted communication, so that I could have a nice visualization of my pfSense firewall logs with syslog and netflow.
I have done this on a Proxmox host, so not all things may apply to your installation.
Table of contents
Getting started
The repository can be found here: https://github.com/psychogun/ELK-Stack-on-Ubuntu-for-pfSense.
Logstash combines logdata from different sources to a joint Java Script Object Notation (JSON)-format. Elasticsearch indexes and saves JSON-logdata in a central database. Kibana graphically presents logdata to the user in a webbrowser.
Logstash
Logstash continiously looks after (different types of) logdata which is presented (syslog, or FileBeat, or Netflow, ++) on specified ports.
Logstash accepts different types of traffic, applies a filter and transforms the logdata to JSON-format which is then sent to Elasticsearch for indexing and saving in a central database.
Elasticsearch
Elasticsearch is a search- and analyze tool based on Apache Lucene. Elasticsearch uses Schema-free database-structure and all data is saved in a JSON-format. You can communicate with Elasticsearch’ database directly be sending requests in JSON-format. This makes Elasticsearch flexible, because the communication is not locked to Kibana.
Kibana
Kibana presents logdata to the user in graphical webpages. The webpages can be used for system monitoring and can be updated in real-time. Kibana is configurable so that the user can choose which data will be extracted from the Elasticsearch database and how they will be presented.
In Kibana you can create customized control panels for various applications. Kibana combined with SHIELD controls access to the control panel according to the need-to-know principle.
SHIELD
SHIELD contains a security API that lays on the top of the ELK stack and acts as a security layer.
SHIELD has the following main features:
- Authentication
- Authorization
- Secure network communication
- IP filtering
- Traceability
SHIELD is a commercial product, so you’ll have to pay for it.
pfSense
pfSense is an open source firewall/router computer software distribution based on FreeBSD. It is installed on a physical computer or a virtual machine to make a dedicated firewall/router for a network. It can be configured and upgraded through a web-based interface, and requires no knowledge of the underlying FreeBSD system to manage.
Disclaimer
As with every how-to’s, read through the entire thing before starting.
Prerequisites
- Clean Ubuntu 20.04 LTS
- Java 8
- Elasticsearch 7.2
- Logstash 7.6.2
- Kibana 7.
- PFSene 2.4.4
I am running the Elastic Stack on a 4 x Intel(R) Xeon(R) CPU E3-1225 v3 @ 3.20GHz (1 Socket) machine, with 2 cores and 8GB of RAM allocated to the virtual guest.
Installlation
First and foremost, update and upgrade our Ubuntu installation:
elk@stack:~$ sudo apt-get update
elk@stack:~$ sudo apt-get upgrade
Set the correct date and time:
elk@stack:~$ sudo dpkg-reconfigure tzdata
elk@stack:~$ timedatectl set-ntp off
elk@stack:~$ sudo nano /etc/systemd/timesyncd.conf
Add Servers=192.168.40.1
elk@stack:~$ usr/share/kibana/bin$ timedatectl set-ntp on
Install qemu-guest-agent
The qemu-guest-agent is a helper daemon, which is installed in the guest. It is used to exchange information between the host and guest, and to execute command in the guest.
In Proxmox VE, the qemu-guest-agent is used for mainly two things:
To properly shutdown the guest, instead of relying on ACPI commands or windows policies To freeze the guest file system when making a backup (on windows, use the volume shadow copy service VSS).
elk@stack:~$ sudo apt-get install qemu-guest-agent
elk@stack:~$ sudo shutdown now
In Proxmox, go to Options and Enable by selecting Use QEMU Guest Agent. Start your VM again.
Installing Java
Logstash requires Java 8 or Java 11, so we’ll go ahead and install the OpenJDK Runtime Environment https://www.elastic.co/de/support/matrix#matrix_jvm.
I opted for Java 11:
elk@stack:~$ sudo apt install -y openjdk-11-jdk
Was it installed properly?
elk@stack:~$ java -version
openjdk version "11.0.7" 2020-04-14
OpenJDK Runtime Environment (build 11.0.7+10-post-Ubuntu-3ubuntu1)
OpenJDK 64-Bit Server VM (build 11.0.7+10-post-Ubuntu-3ubuntu1, mixed mode, sharing)
You’ll have to ensure that your JAVA_HOME environment is properly set up. To see your current JAVA_HOME environment variable, issue command:
elk@stack:~$ echo $JAVA_HOME
If nothing shows up, your JAVA_HOME environment path is not set. To set your JAVA_HOME path, run:
elk@stack:~$ export JAVA_HOME=/usr/lib/jvm/java-11-openjdk-amd64
Add JAVA bin directory to the PATH variable:
elk@stack:~$ export PATH=$PATH:$JAVA_HOME/bin
Check your PATH variable:
elk@stack:~$ echo $PATH
/usr/local/sbin:/usr/local/bin:/usr/sbin:/usr/bin:/sbin:/bin:/usr/games:/usr/local/games:/snap/bin:/usr/lib/jvm/java-8-openjdk-amd64/bin
Ok, continue.
Installing Elasticsearch
We’ll install Elasticsearch first, because Logstash and Kibana are dependent on Elasticsearch. When you install each component of the stack, the install will automatically create service users for running the different components.
Import the Elasticsearch PGP key and install Elasticsearch from the APT repository by following this excellent guide;
- https://www.elastic.co/guide/en/elasticsearch/reference/current/deb.html (also make sure to install
wgetandapt-transport-https).
In order for Elasticsearch to function optimally, you should increase the number of files the (service) user elasticsearch is allowed to open at the same time. Edit limits.conf and add the following:
elk@stack:~$ nano /etc/security/limits.conf
elasticsearch soft nofile 32000
elasticsearch hard nofile 32000
Also edit /etc/sysctl.conf and add the following:
fs.file-max = 300000
(For some more information about file handling, read https://gist.github.com/luckydev/b2a6ebe793aeacf50ff15331fb3b519d).
To enable Elasticsearch to start when you boot, write:
elk@stack:~$ sudo /bin/systemctl enable elasticsearch.service
To start Elasticsearch, write:
elk@stack:~$ sudo systemctl start elasticsearch.service
To see if Elasticsearch has been started as it should, your curl output should look something like this:
elk@stack:~$ curl -X GET http://localhost:9200
{
  "name" : "stack",
  "cluster_name" : "elasticsearch",
  "cluster_uuid" : "kEi4W1ffRcqYhab1ato3xQ",
  "version" : {
    "number" : "7.6.2",
    "build_flavor" : "default",
    "build_type" : "deb",
    "build_hash" : "508c38a",
    "build_date" : "2020-03-20T15:54:18.811730Z",
    "build_snapshot" : false,
    "lucene_version" : "8.4.0",
    "minimum_wire_compatibility_version" : "6.8.0",
    "minimum_index_compatibility_version" : "6.0.0-beta1"
  },
  "tagline" : "You Know, for Search"
}
Installing Logstash
After Elasticsearch is installed, we’ll go ahead and install Logstash.
Follow this excellent guide in in order to install the Public Signing Key and save the repository definition so you can sudo apt-get install logstash (APT):
After installing the package, you can enable and start up Logstash with:
elk@stack:~$ sudo systemctl enable logstash.service
elk@stack:~$ sudo systemctl start logstash.service
To see if our Logstash service is running as it should, issue command:
elk@stack:~$ sudo systemctl status logstash.service
And to stop it?
elk@stack:~$ sudo systemctl stop logstash.service
Just stop it for now.
Pipelines
So. Pipelines. In order to specify how Logstash listens to incoming connections (ports/protocols) and where to send data (Elasticsearch), and whether or not to apply a filter, we will have to create configuration files (input, output, filter) in the JSON-format. Where to put these configuration files (“pipelines”), are stated in /etc/logstash/pipelines.yml:
elk@stack:~$ more /etc/logstash/pipelines.yml
# This file is where you define your pipelines. You can define multiple.
# For more information on multiple pipelines, see the documentation:
#   https://www.elastic.co/guide/en/logstash/current/multiple-pipelines.html

- pipeline.id: main
  path.config: "/etc/logstash/conf.d/*.conf"
You can have one “big” .conf configuration file, or you can separate the outputs, inputs and filters in multiple .conf configuration files. You will see I have some separated (syslog), and one joined (netflow):
Download and configure the input file /etc/logstash/conf.d/01-inputs.conf:
elk@stack:~$ cd /etc/logstash/conf.d/
elk@stack:/etc/logstash/conf.d$ sudo wget https://raw.githubusercontent.com/psychogun/ELK-Stack-on-Ubuntu-for-pfSense/master/etc/logstash/conf.d/01-inputs.conf
elk@stack:/etc/logstash/conf.d$ more 01-inputs.conf
input {
  tcp {
    type => "syslog"
    port => 5140
  }
}

input {
  udp {
    type => "syslog"
    port => 5140
  }
}
This particular input file listens for syslog’s on both TCP and UDP at port 5140.
Download and configure the syslog filter file /etc/logstash/conf.d/10-syslog.conf:
elk@stack:/etc/logstash/conf.d$ sudo wget https://raw.githubusercontent.com/psychogun/ELK-Stack-on-Ubuntu-for-pfSense/master/etc/logstash/conf.d/10-syslog.conf
elk@stack:/etc/logstash/conf.d$ more 10-syslog.conf
filter {
  if [type] == "syslog" {
    if [host] =~ /192\.168\.40\.1/ {
      mutate {
        add_tag => ["pfsense", "Ready"]
      }
    }
    if [host] =~ /172\.2\.22\.1/ {
      mutate {
        add_tag => ["pfsense-2", "Ready"]
      }
    }

    if "Ready" not in [tags] {
      mutate {
        add_tag => [ "syslog" ]
      }
    }
  }
}
filter {
  if [type] == "syslog" {
    mutate {
      remove_tag => "Ready"
    }
  }
}
filter {
  if "syslog" in [tags] {
    grok {
      match => { "message" => "%{SYSLOGTIMESTAMP:syslog_timestamp} %{SYSLOGHOST:syslog_hostname} %{DATA:syslog_program}(?:\[%{POSINT:syslog_pid}\])?: %{GREEDYDATA:syslog_message}" }
      add_field => [ "received_at", "%{@timestamp}" ]
      add_field => [ "received_from", "%{host}" ]
    }
    syslog_pri { }
    date {
      match => [ "syslog_timestamp", "MMM  d HH:mm:ss", "MMM  dd HH:mm:ss" ]
      locale => "en"
    }
    if !("_grokparsefailure" in [tags]) {
      mutate {
        replace => [ "@source_host", "%{syslog_hostname}" ]
        replace => [ "@message", "%{syslog_message}" ]
      }
    }
    mutate {
      remove_field => [ "syslog_hostname", "syslog_message", "syslog_timestamp" ]
    }
  }
}
I will not try to explain what the filter for syslog exactly does (because I have no experience with JSON). But, to my knowledge, you can see that it tags syslog traffic from my pfSense with both pfsense and Ready, and adds some extra fields. The if [host] =~ /192\.168\.40\.1/ { is the IP adresss (192.168.40.1) to my pfSense firewall, which address you’ll probably want to change. And if you have another pfSense firewall, add it here as well (the if [host] with the 172.22.2.1 address).
Download and configure the pfSense filter /etc/logstash/conf.d/11-pfsense.conf:
elk@stack:/etc/logstash/conf.d$ sudo wget https://raw.githubusercontent.com/psychogun/ELK-Stack-on-Ubuntu-for-pfSense/master/etc/logstash/conf.d/11-pfsense.conf
elk@stack:/etc/logstash/conf.d$ more /etc/logstash/conf.d/11-pfsense.conf
filter {
  if "pfsense" in [tags] {
    grok {
      add_tag => [ "firewall" ]
      match => [ "message", "<(?<evtid>.*)>(?<datetime>(?:Jan(?:uary)?|Feb(?:ruary)?|Mar(?:ch)?|Apr(?:il)?|May|Jun(?:e)?|Jul(?:y)?|Aug(?:ust)?|Sep(?:tember)?|Oct(?:ober)?|Nov(?:ember)?|Dec(?:ember)?)\s+(?:(?:0[1-9])|(?:[12][0-9])|(?:3[01])|[1-9]) (?:2[0123]|[01]?[0-9]):(?:[0-5][0-9]):(?:[0-5][0-9])) (?<prog>.*?): (?<msg>.*)" ]
            }
            mutate {
              gsub => ["datetime","  "," "]
            }
            date {
              match => [ "datetime", "MMM dd HH:mm:ss" ]
              timezone => "Europe/Paris"
            }
            mutate {
              replace => [ "message", "%{msg}" ]
            }
            mutate {
              remove_field => [ "msg", "datetime" ]
            }
            if [prog] =~ /^dhcpd$/ {
              mutate {
                add_tag => [ "dhcpd" ]
              }
             grok {
                 patterns_dir => ["/etc/logstash/conf.d/patterns"]
                 match => [ "message", "%{DHCPD}"]
             }
            }
            if [prog] =~ /^suricata/ {
              mutate {
                add_tag => [ "SuricataIDPS" ]
              }
              grok {
                  patterns_dir => ["/etc/logstash/conf.d/patterns"]
                  match => [ "message", "%{PFSENSE_SURICATA}"]
             }
                if ![geoip] and [ids_src_ip] !~ /^(10\.|192\.168\.)/ {
                  geoip {
                    add_tag => [ "GeoIP" ]
                    source => "ids_src_ip"
                    database => "/etc/logstash/GeoLite2-City.mmdb"
                  }
                }
            if [prog] =~ /^suricata/ {
                mutate {
                    add_tag => [ "ET-Sig" ]
                    add_field => [ "Signature_Info", "http://doc.emergingthreats.net/bin/view/Main/%{[ids_sig_id]}" ]
                }
              }
            }
            if [prog] =~ /^charon$/ {
              mutate {
                add_tag => [ "ipsec" ]
              }
            }
            if [prog] =~ /^barnyard2/ {
              mutate {
                add_tag => [ "barnyard2" ]
              }
            }
            if [prog] =~ /^openvpn/ {
              mutate {
                add_tag => [ "openvpn" ]
              }
            }
            if [prog] =~ /^ntpd/ {
              mutate {
                add_tag => [ "ntpd" ]
              }
            }
            if [prog] =~ /^php-fpm/ {
              mutate {
                add_tag => [ "web_portal" ]
              }
              grok {
                  patterns_dir => ["/etc/logstash/conf.d/patterns"]
                  match => [ "message", "%{PFSENSE_APP}%{PFSENSE_APP_DATA}"]
              }
              mutate {
                  lowercase => [ 'pfsense_ACTION' ]
              }
            }
            if [prog] =~ /^apinger/ {
              mutate {
                add_tag => [ "apinger" ]
              }
            }
            if [prog] =~ /^filterlog$/ {
                mutate {
                    remove_field => [ "msg", "datetime" ]
                }
                grok {
                    add_tag => [ "firewall" ]
                    patterns_dir => ["/etc/logstash/conf.d/patterns"]
                    match => [ "message", "%{PFSENSE_LOG_DATA}%{PFSENSE_IP_SPECIFIC_DATA}%{PFSENSE_IP_DATA}%{PFSENSE_PROTOCOL_DATA}",
                               "message", "%{PFSENSE_IPv4_SPECIFIC_DATA}%{PFSENSE_IP_DATA}%{PFSENSE_PROTOCOL_DATA}",
                               "message", "%{PFSENSE_IPv6_SPECIFIC_DATA}%{PFSENSE_IP_DATA}%{PFSENSE_PROTOCOL_DATA}"]
                }
                mutate {
                    lowercase => [ 'proto' ]
                }
                if ![geoip] and [src_ip] !~ /^(10\.|192\.168\.)/ {
                  geoip {
                    add_tag => [ "GeoIP" ]
                    source => "src_ip"
                    database => "/etc/logstash/GeoLite2-City.mmdb"
                  }
                }
            }
        }
}
PS: Remember to change your timezone to a correct zone timezone => "Europe/Paris" in 11-pfsense.conf.
Since we have the Elastic stack installed on the same machine, our Logstash would connect to Elasticsearch (30-outputs.conf) like this:
elk@stack:/etc/logstash/conf.d$ sudo wget https://raw.githubusercontent.com/psychogun/ELK-Stack-on-Ubuntu-for-pfSense/master/etc/logstash/conf.d/30-outputs.conf
elk@stack:/etc/logstash/conf.d$ more 30-outputs.conf
output {
        elasticsearch {
                hosts => ["http://localhost:9200"]
                index => "logstash-%{+YYYY.MM.dd}" }
}
The index statement dictates that a rotating of the database file with a date stamp will occour.
If you want to view the Logstash output realtime, you could also send output to console by adding stdout:
elk@stack:~$ more /etc/logstash/conf.d/30-outputs.conf
output {
        elasticsearch {
                hosts => ["http://localhost:9200"]
                index => "logstash-%{+YYYY.MM.dd}" }
                stdout { codec => rubydebug }
}
**Disclaimer: I have to investigate why that is not working (stdout)
If you have Logstash running, stop it; sudo systemctl stop logstash.service (because we are referencing geoip and a different non-standard grok pattern match => in our logstash configs, which we haven’t installed yet, you’ll see in /var/log/logstash/logstash-plain.log that logstash will not boot well with our current configured pipelines).
Use tail -f to tail the log for Logstash:
elk@stack:/etc/logstash/conf.d$ tail -f /var/log/logstash/logstash-plain.log
MaxMind GeoIP database
Go to https://www.maxmind.com and register for a free account to download this database. Take a note of your license key.
Download and extract the MaxMind GeoIP database, replace YOUR_LICENSE_KEY with your license key:
elk@stack:~$ cd /etc/logstash
elk@stack:/etc/logstash$ sudo wget "https://download.maxmind.com/app/geoip_download?edition_id=GeoLite2-City&license_key=YOUR_LICENSE_KEY&suffix=tar.gz"
elk@stack:/etc/logstash$ sudo mv 'geoip_download?edition_id=GeoLite2-City&license_key=YOUR_LICENSE_KEY&suffix=tar.gz' GeoLite2-City.tar.gz
elk@stack:/etc/logstash$ sudo wget "https://download.maxmind.com/app/geoip_download?edition_id=GeoLite2-City&license_key=YOUR_LICENSE_KEY&suffix=tar.gz.sha256 "
elk@stack:/etc/logstash$ sudo mv 'geoip_download?edition_id=GeoLite2-City&license_key=YOUR_LICENSE_KEY&suffix=tar.gz.sha256' GeoLite2-City.tar.gz.sha256
Was the download correct?
elk@stack:/etc/logstash$ sudo sha256sum -c GeoLite2-City.tar.gz.sha256
sha256sum: GeoLite2-City_20200428.tar.gz: No such file or directory
(...)
elk@stack:/etc/logstash$ sudo mv GeoLite2-City.tar.gz GeoLite2-City_20200428.tar.gz
elk@stack:/etc/logstash$ sudo sha256sum -c GeoLite2-City.tar.gz.sha256
GeoLite2-City_202000428.tar.gz: OK
Unzip to fetch the GeoLite2-City.mmdb file and move it to the directory defined in 11-pfsense.conf, /etc/logstash/:
elk@stack:/etc/logstash$ sudo tar xvzf GeoLite2-City_20200428.tar.gz
elk@stack:/etc/logstash$ sudo mv GeoLite2-City_20200428/GeoLite2-City.mmdb .
Clean up:
elk@stack:/etc/logstash$ sudo rm -rf GeoLite2-City_20200428
Grok
Grok is a great way to parse unstructured log data into something structured and queryable. Sometimes logstash doesn’t have a pattern you need, so you’ll have to make it yourself. Or download it:
elk@stack:~$ cd /etc/logstash/conf.d/
elk@stack:/etc/logstash$ sudo mkdir patterns
elk@stack:/etc/logstash$ cd patterns
elk@stack:/etc/logstash/patterns$ sudo wget https://raw.githubusercontent.com/psychogun/ELK-Stack-on-Ubuntu-for-pfSense/master/etc/logstash/conf.d/patterns/pfsense_2_4_2.grok
Now, go ahead and start Logstash!
elk@stack:~$ sudo systemctl start logstash
Hopefully it started succesfully:
elk@stack:~$ sudo systemctl status logstash.service
Installing Kibana
Follow this excellent guide to install Kibana and make it start automatically when the system boots :
Kibana loads its configuration from the /etc/kibana/kibana.yml file by default. The format of this config file is explained in https://www.elastic.co/guide/en/kibana/7.2/settings.html
What we first and foremost want to do with our kibana.yml, is to edit the server.host: "localhost"and bind it to (all) interfaces by writing server.host: "0.0.0.0".
elk@stack:~$ sudo nano /etc/kibana/kibana.yml
Editing this parameter from a non-loopback address enables connections from remote users, thus enables us to connect to Kibana through a web-browser from another client.
If our Elasticsearch database is not on the same host as Kibana, you will have to tell where Elasticsearch is by specifying elasticsearch.hosts, e.g.: elasticsearch.hosts http://ip-adress:9200 in kibana.yml
restart or start your Kibana with sudo systemctl start kibana and go to http://ip-adress:5601 to check if it is up and running (choose No when asked if you want to import some data). Select ‘Explore on your own’, we’ll get back to Kibana in a bit. Now we need some data to visualize, e.g. make pfSense send data to logstash.
Configuration
pfSense and Syslog
Log on to your pfSense and go to Status > System logs > Settings.
For content, we will log “Firewall Events”.
Enable Remote Logging and point one of the ‘Remote log servers’ to ‘ip:port’, e.g.: 192.168.4.100:5140, as stated in 01-inputs.conf. Syslog sends UDP datagrams to port 514 on the specified remote syslog server, unless another port is specified.
PS: Be sure to remember to enable logging in your firewall rules, ‘Log packets that are handled by this rule’. For instance, all the rulesets on my WAN interface has logging enabled.
Kibana configuration
Index patterns
Index patterns tell Kibana which Elasticsearch indices you want to explore. An index pattern can match the name of a single index, or include a wildcard (*) to match multiple indices.
For example, Logstash typically creates a series of indices in the format logstash-YYYY.MMM.DD. To explore all of the log data from May 2018, you could specify the index pattern logstash-2018.05*.
Discover
Discover enables you to explore your data with Kibana’s data discovery functions. You have access to every document in every index that matches the selected index pattern. You can submit search queries, filter the search results, and view document data.
Visualization
Kibana visualizations are based on Elasticsearch queries. By using a series of Elasticsearch aggregations to extract and process your data, you can create charts that show you the trends, spikes, and dips you need to know about.
Dashboard
A Kibana dashboard displays a collection of visualizations, searches, and maps. You can arrange, resize, and edit the dashboard content and then export the dashboard so you can share it.
Go to http://ip-adress:5601 and go to Management > Index Patterns (Kibana) and click Create index pattern. Our logstash service which we started have enabled us to select that indicies, so write “logstash*”. Press ‘Next step’. Under ‘Time Filter field name’ choose ‘@timestamp’ and then hit ‘Create Index pattern’.
Saved Objects
With ‘Saved Objects’ you are able to import searches, dashboards and visualizations that has been made before. Let us do that.
Go to Saved Objects > Import > and import ‘Discover - Firewall and pfSense.json’ (you might have to re-associate the object with your logstash* index pattern). You are successfull when you have imported 6 objects. https://github.com/psychogun/ELK-Stack-on-Ubuntu-for-pfSense/tree/master/Discover%20(search).
PS: Use your favourite editor to (eventually) search + replace the external interface name from what I have, re0, to what your WAN interface on your pfSense is called (e.g. em1) before importing.
Now import ‘Visualizations - Firewall and pfSense.json’ (you might have to re-associate the object with your logstash* index pattern). You are successfull when you have imported 31 objects. https://github.com/psychogun/ELK-Stack-on-Ubuntu-for-pfSense/tree/master/Visualization.
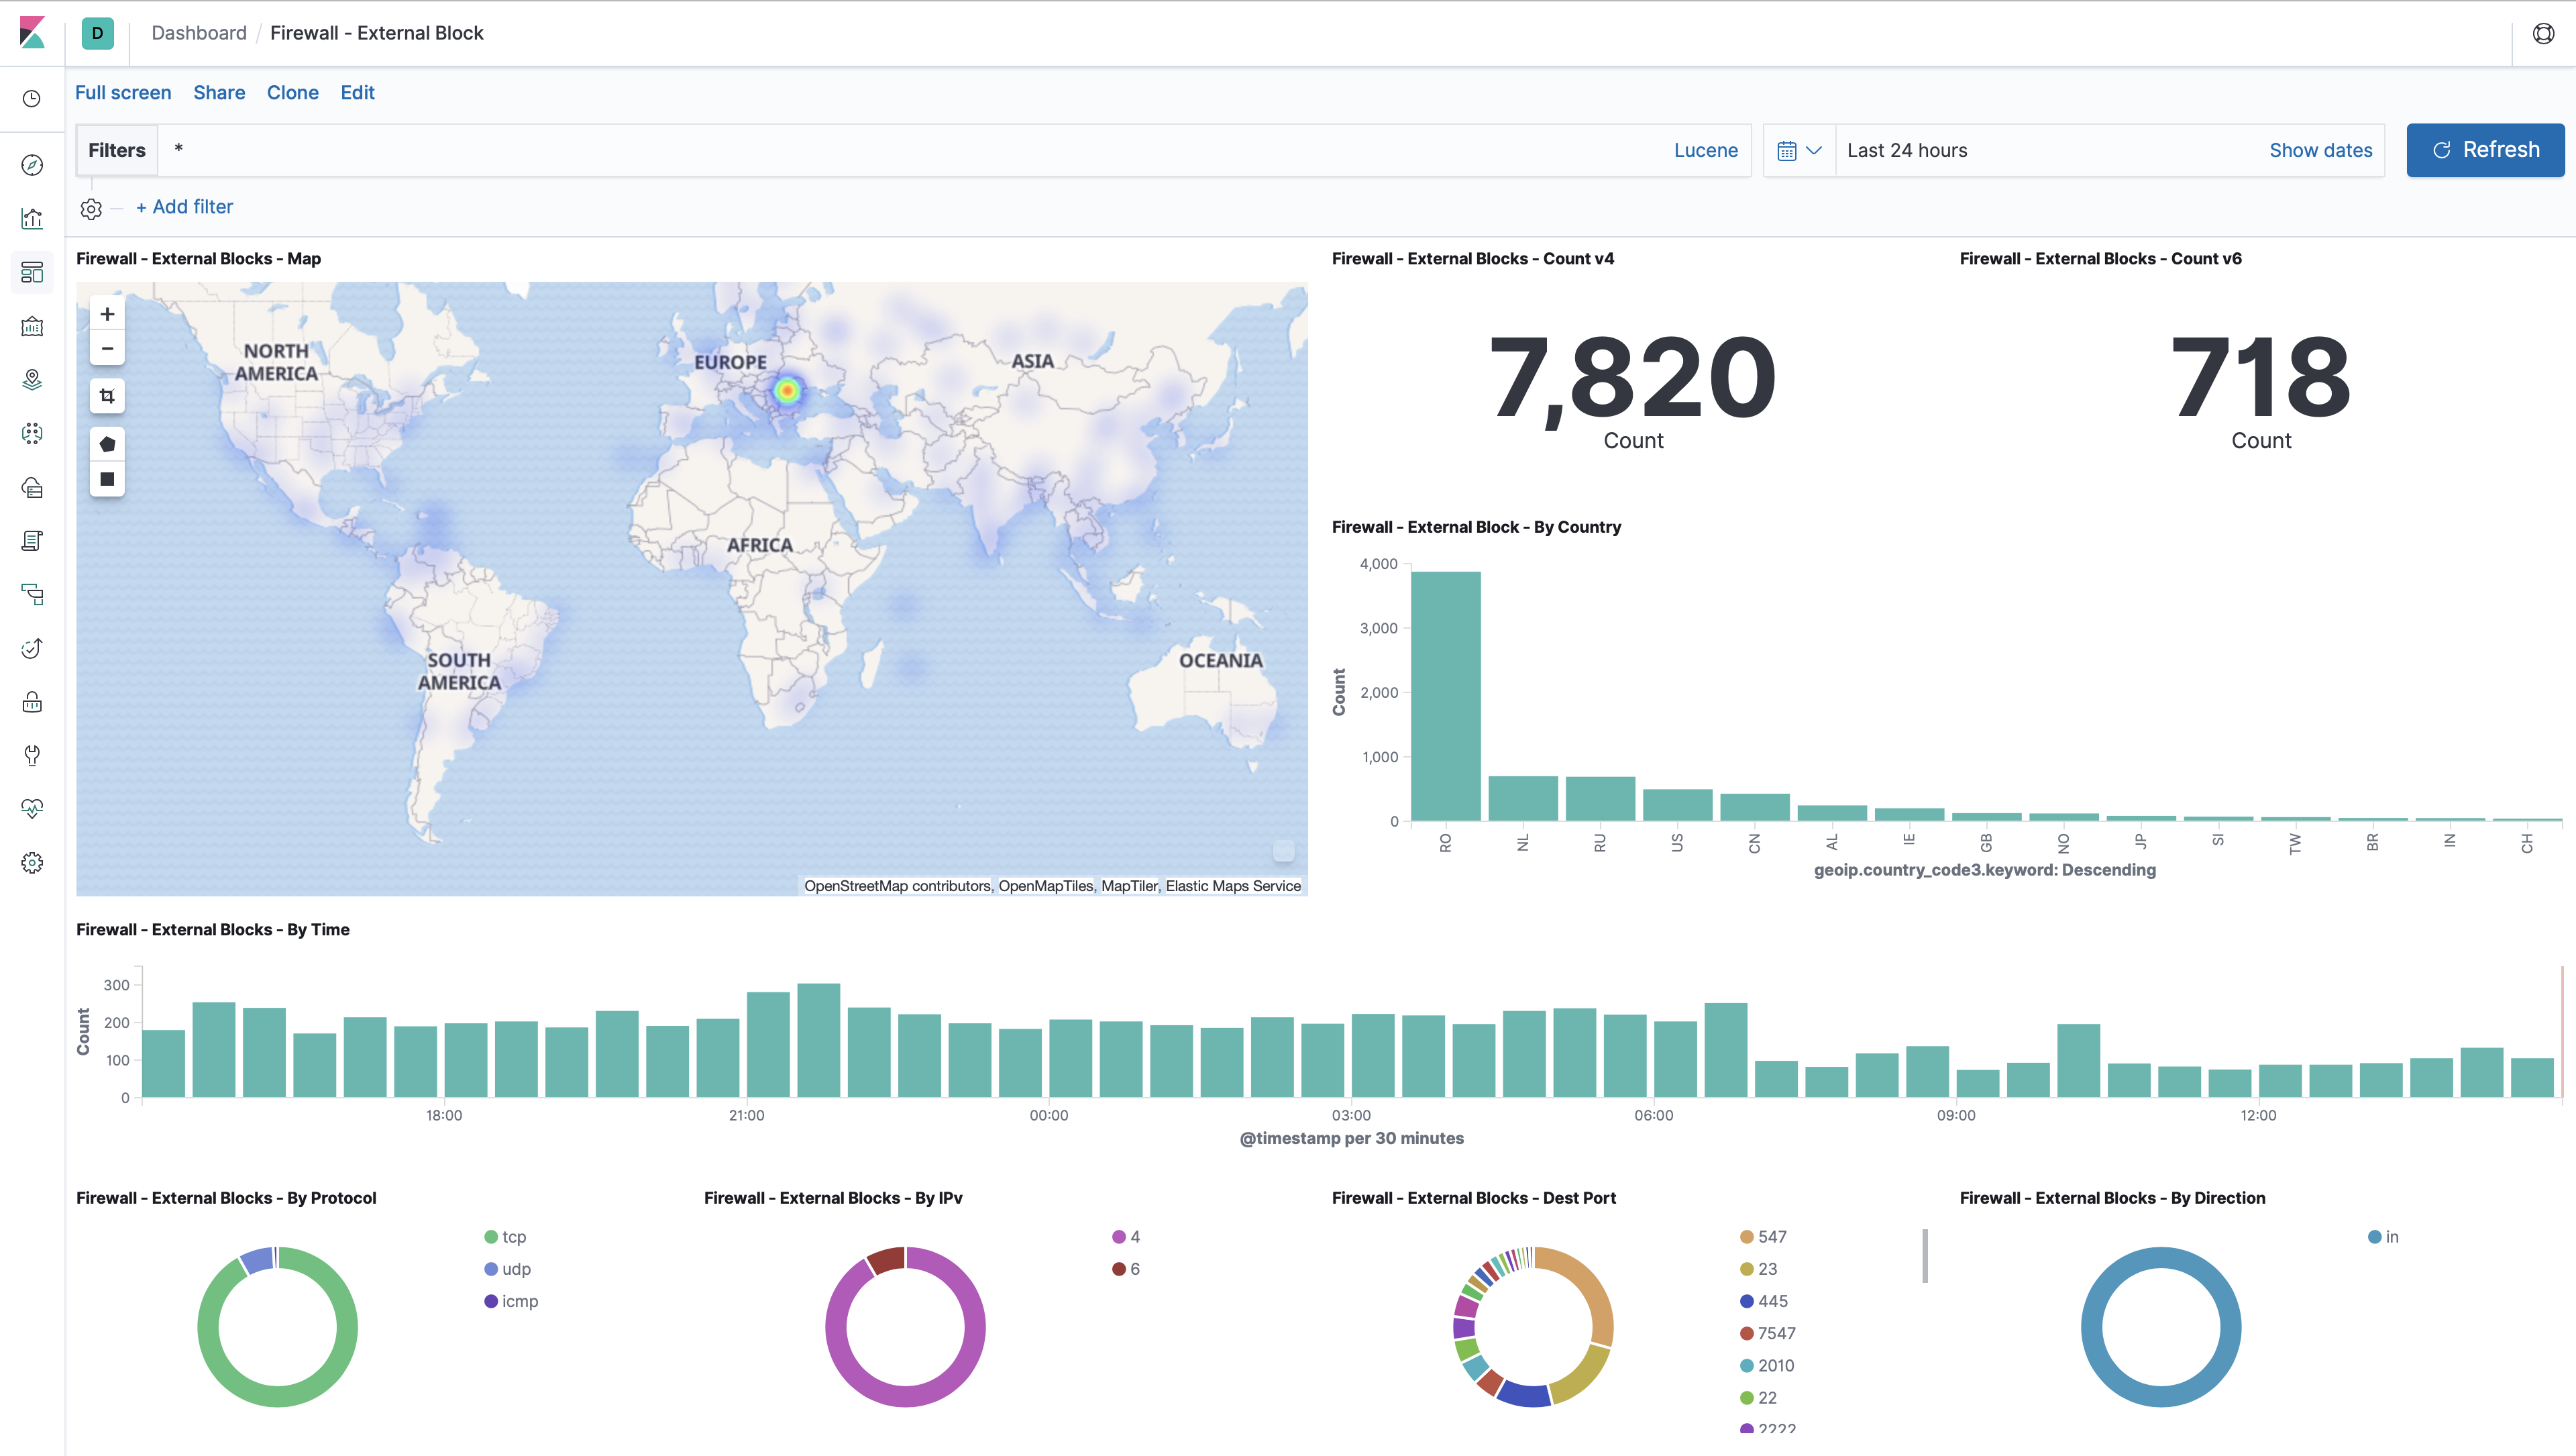
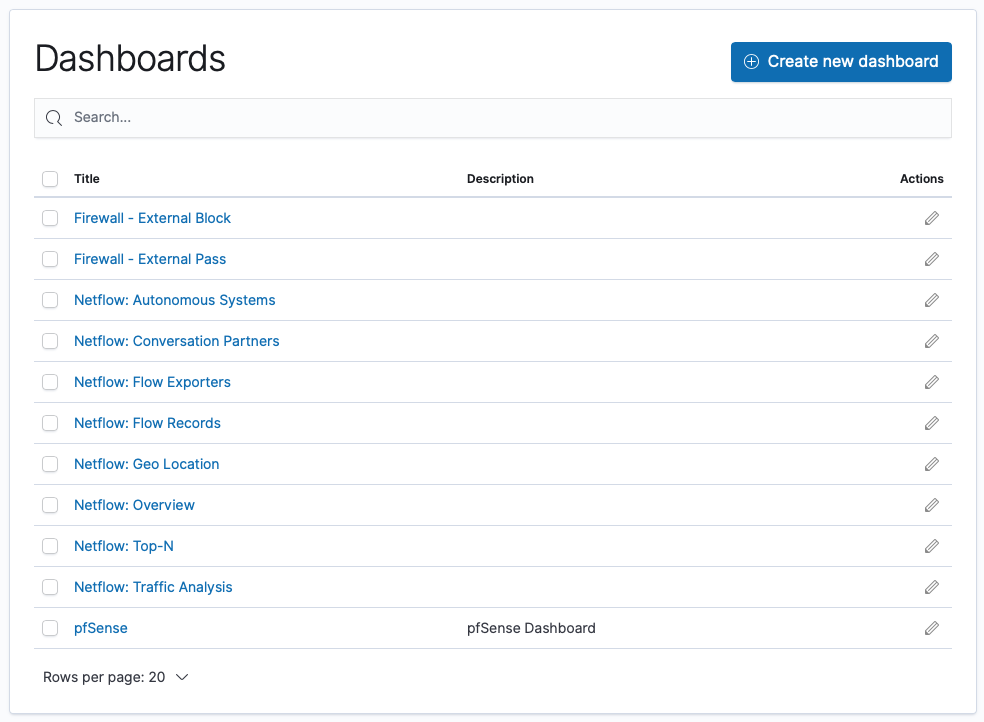
Now you can create your own dashboard and mix those visualizations in how you please. Or import them. Import “Dashboard - Firewall - External Block.json”, “Dashboard - Firewall - External Pass.json” and “Dashboard - pfSense.json” from: https://github.com/psychogun/ELK-Stack-on-Ubuntu-for-pfSense/tree/master/Dashboard.
Hopefully you have 3 dashboards now. One which is showing blocked traffic, one which is showing traffic that is let through, and one “overall” dashboard with syslog events from your pfSense firewall. Congratulations :)
pfSense and Netflow
Log on to your PFSense and go to System > Package Manager > Available Packages and install softflowd. Edit softlowd by navigating to Services > softlowd. A basic configuration looks like this:
- Select which interfaces to monitor. I selected WAN.
- Enter your logstash server IP address for Host.
- Enter 2055 for Port.
- Select Netflow version 9.
- Set Flow Tracking Level to Full.
- Click Save.
PS: Communication between softflowd and Logstash for Netflow is not encrypted. Make sure you are creating a good network design by using VLAN or something else to ensure the metadata of the communication on your monitored interfaces is not intentionally going where it should not go.
Logstash and Netflow
Stop logstash.service:
elk@stack:/usr/share/logstash$ sudo systemctl stop logstash.service
For a one-time run, execute logstash with netflow and the –setup parameter:
elk@stack:/usr/share/logstash$ sudo /usr/share/logstash/bin/logstash --modules netflow --setup
The --setup parameter will add searches, dashboards and vizualisations in Kibana for netflow module. PS: If you run logstash with parameter --setup one more time, it will override your (eventual) dashboard edits concerning Netflow. Wait a minute and check if the different netflow dashboards have been generated by --setup in Kibana from your webbrowser.
What I discovered when specifying netflow as a module in logstash.yml, was that logstash is ignoring the ‘pipelines.yml’ file because modules or command line options are specified. So the pfSense syslogs broke.
So what we want to do, is to edit the /usr/share/logstash/modules/netflow/configuration/logstash/netflow.conf.erb file to a conf file, like the ones you now have in /etc/logstash/conf.d/.
elk@stack:~$ cd /usr/share/logstash/modules/netflow/configuration/logstash
elk@stack:/usr/share/logstash/modules/netflow/configuration/logstash$ sudo cp netflow.conf.erb /etc/logstash/conf.d/netflow.conf
netflow.conf.erb is an ERB template so there are sections that are overwritten, in between <%=, %>, with real values - replace these and you will have a netflow config.
You can do that by yourself, sudo nano /etc/logstash/conf.d/netflow.conf or just wget this netflow.conf;
PS: Remember to edit the output section of netflow.conf so it matches your network.
elk@stack:/etc/logstash$ cd conf.d/
elk@stack:/etc/logstash/conf.d$ sudo wget https://raw.githubusercontent.com/psychogun/ELK-Stack-on-Ubuntu-for-pfSense/master/etc/logstash/conf.d/netflow.conf
Let’s start logstash.service and check in Kibana that both the netflow and pfSense dashboards are populating logdata (depending on how heavy the traffic is to your pfSense, this might take some minutes to confirm that all dashboards are working).
elk@stack:/usr/share/logstash$ sudo systemctl start logstash.service
Voilà. Netflow and syslogs in Kibana from pfSense. Another congratulations is in order! :)
Securing our Elastic Stack
Enable HTTPS on Kibana
You are able to access the Kibana interface via https by setting server.sssl.enable to true in kibana.yml configuration file. To be able to do so, you have to create your certificates.
Generate a key with a pass-phrase:
elk@stack:~$ cd /etc/kibana
elk@stack:/etc/kibana$ sudo openssl genrsa -des3 -out server.key 2048
Now create the insecure key, the one without a passphrase, and shuffle the key names:
elk@stack:/etc/kibana$ sudo openssl rsa -in server.key -out server.key.insecure
elk@stack:/etc/kibana$ sudo mv server.key server.key.secure
elk@stack:/etc/kibana$ sudo mv server.key.insecure server.key
The insecure key is now named server.key, and you can use this file to generate the CSR without passphrase. CSR stands for Certificate Signing Request.
To create the CSR, run the following command at a terminal prompt:
elk@stack:/etc/kibana$ sudo openssl req -new -key server.key -out server.csr
This server.csr file would normally go to a Certificate Authoriy (CA) for issuing a “stamp” saying; hey- this is a legit site. Instead of sending this to a CA, we are making this “stamp” our selves by creating a Self-Signed Certificate:
elk@stack:/etc/kibana$ sudo openssl x509 -req -days 365 -in server.csr -signkey server.key -out server.crt
Now you have server.crt and server.key.
In kibana.yml we point to these certifications, elk@stack:~$ sudo nano /etc/kibana/kibana.yml:
# Enables SSL and paths to the PEM-format SSL certificate and SSL key files, respectively.
# These settings enable SSL for outgoing requests from the Kibana server to the browser.
server.ssl.enabled: true
server.ssl.certificate: /etc/kibana/server.crt
server.ssl.key: /etc/kibana/server.key
Make server.key readable for the service user kibana;
elk@stack:/etc/kibana$ sudo chmod 644 server.key
Stop and start kibana:
elk@stack:/etc/kibana$ sudo systemctl stop kibana.service
elk@stack:/etc/kibana$ sudo systemctl start kibana.service
Now you are able to communicate with Kibana over an encrypted connection (https) from your webbrowser. Hooray!
TLS on Elasticsearch
Starting with Elastic Stack 6.8 and 7.1, security features like TLS encrypted communication, role-based access control (RBAC), and more are available for free within the default distribution. For further hardening of your Elastic Stack, go to https://www.elastic.co/subscriptions to see if you are willing to pay the dues.
The simplest way that Kibana and/or application servers can authenticate to an Elasticsearch cluster is by embedding a username and password in their configuration files or source code.
Elasticsearch has two levels of communications, transport communications and http communications. The transport protocol is used for internal communications between Elasticsearch nodes, and the http protocol is used for communications from clients (Logstash, Kibana, etc.) to the Elasticsearch cluster.
Generate certificates
elk@stack:~$ cd /usr/share/elasticsearch/
elk@stack:/usr/share/elasticsearch$ sudo bin/elasticsearch-certutil ca
[PRESS ENTER TWICE]
You have now created a CA (Certificate Authority) called elastic-stack-ca.p12. From this CA, we can create a certificate;
elk@stack:/usr/share/elasticsearch$ sudo bin/elasticsearch-certutil cert --ca elastic-stack-ca.p12
[PRESS ENTER THREE TIMES]
elastic-certificates.p12
Once the above commands have been executed, we will have TLS/ SSL certificates that can be used for encrypting communications. We want to move the elastic-certificates.p12 file to folder /etc/elasticsearch/certs/:
elk@stack:/usr/share/elasticsearch$ sudo -i
root@stack:~# mv /usr/share/elasticsearch/elastic-certificates.p12 /etc/elasticsearch/certs/
Make it readable for elasticsearch.service:
root@stack:~# cd /etc/elasticsearch/
root@stack:/etc/elasticsearch# chown -R root:elasticsearch certs/
root@stack:/etc/elasticsearch# cd certs/
root@stack:/etc/elasticsearch/certs# chmod 660 elastic-certificates.p12
The certificates for transport communication will then be enabled in elasticsearch.yml file as follows (just add it to the bottom of the file):
Enable TLS in Elasticsearch
root@stack:~# nano /etc/elasticsearch/elasticsearch.yml
xpack.security.enabled: true
xpack.security.transport.ssl.enabled: true
xpack.security.transport.ssl.verification_mode: certificate
xpack.security.transport.ssl.keystore.path: certs/elastic-certificates.p12
xpack.security.transport.ssl.truststore.path: certs/elastic-certificates.p12
Now restart our Elasticsearch for the above changes to take effect:
root@stack:~# exit
logout
elk@stack:/usr/share/elasticsearch$ sudo systemctl stop elasticsearch.service
elk@stack:/usr/share/elasticsearch$ sudo systemctl start elasticsearch.service
We must now define passwords for the built-in users (defining built-in user’s passwords should be completed before we enable TLS/SSL for http communications, as the command to set passwords will communicate with the cluster via unsecured http).
This command is intended for use only during the initial configuration of the Elasticsearch security features. It uses the elastic bootstrap password to run user management API requests. After you set a password for the elastic user, the bootstrap password is no longer active and you cannot use this command (instead, you can change passwords by using the Management > Users UI in Kibana or the Change Password API).
Using auto, the passwords will be randomly generated and printed to the console. To set them yourself, use interactive.
elk@stack:/usr/share/elasticsearch$ sudo -i
root@stack:~# cd /usr/share/elasticsearch/
root@stack:/usr/share/elasticsearch# bin/elasticsearch-setup-passwords auto
Be sure to remember the passwords that we have assigned for each of the built-in users. We will make use of the elastic superuser to help configure PKI authentication later on.
We’ll use the same certificates for http communications as we have already used for the transport communications. These are specified in the elasticsearch.yml file as follows for the http communication:
root@stack:/usr/share/elasticsearch# sudo nano /etc/elasticsearch/elasticsearch.yml
xpack.security.http.ssl.enabled: true
xpack.security.http.ssl.keystore.path: certs/elastic-certificates.p12
xpack.security.http.ssl.truststore.path: certs/elastic-certificates.p12
xpack.security.http.ssl.client_authentication: optional

#xpack.security.authc.realms.pki1.type: pki
Once the above changes have been made to our elasticsearch.yml file, we will have to restart Elasticsearch:
root@stack:/usr/share/elasticsearch# exit
logout
elk@stack:/usr/share/elasticsearch$ sudo systemctl stop elasticsearch
elk@stack:/usr/share/elasticsearch$ sudo systemctl start elasticsearch
Certificates that will be used for PKI authentication must be signed by the same CA as the certificates that are used for encrypting http communications. Normally, these would be signed by an official CA within an organization. However, because we have already used a self signed CA, we also sign our http client certificates with that same self-signed CA which we previously saved as elastic-stack-ca.p12. We can create a certificate for client authentication as follows:
elk@stack:/usr/share/elasticsearch$ sudo bin/elasticsearch-certutil cert --ca elastic-stack-ca.p12 -name "CN=localhost,OU=Space Adventure,DC=cobra,DC=com"
[PRESS ENTER TWICE]
Please enter the desired output file [CN=localhost,OU=Space Adventure,DC=cobra,DC=com.p12]: client.p12
[PRESS ENTER TWICE]
For any given connection, the SSL/TLS certificates must have a subject that matches the value specified for hosts, or the SSL handshake fails. For example, if you specify hosts: [“foobar:9200”], the certificate MUST include foobar in the subject (CN=foobar) or as a subject alternative name (SAN). Make sure the hostname resolves to the correct IP address. If no DNS is available, then you can associate the IP address with your hostname in /etc/hosts (on Unix) or C:\Windows\System32\drivers\etc\hosts (on Windows).
The above will create a file called client.p12, which contains all of the information required for PKI authentication to our Elasticsearch cluster. However, in order to use this certificate it is helpful to break it into its private key, public certificate, and CA certificate. This can be done with the following commands: Private Key:
root@stack:/usr/share/elasticsearch# openssl pkcs12 -in client.p12 -nocerts -nodes > client.key
[PRESS ENTER TWICE]
Public Certificate:
root@stack:/usr/share/elasticsearch# openssl pkcs12 -in client.p12 -clcerts -nokeys  > client.cer
[PRESS ENTER TWICE]
CA Certificate:
root@stack:/usr/share/elasticsearch# openssl pkcs12 -in client.p12 -cacerts -nokeys -chain > client-ca.cer
[PRESS ENTER TWICE]
Which should produce three files:
- client.key — The private key
- client.cer — The public certificate
- client-ca.cer — The CA that signed the public certificate
Create a directory called certs in the Kibana config directory, and move all of the client certificates there.
root@stack:/usr/share/elasticsearch# exit
logout
elk@stack:/usr/share/elasticsearch$ sudo mkdir /etc/kibana/certs/
elk@stack:/usr/share/elasticsearch$ sudo mv client.key /etc/kibana/certs/
elk@stack:/usr/share/elasticsearch$ sudo mv client.cer /etc/kibana/certs/
elk@stack:/usr/share/elasticsearch$ sudo mv client-ca.cer /etc/kibana/certs/
Configure Kibana to authenticate to Elasticsearch
Now that we have enabled security on Elasticsearch, communications to Elasticsearch must be authenticated. Therefore, if we plan on using Kibana to interact with Elasticsearch, then we must enable security and configure Kibana to authenticate to Elasticsearch as the kibana user over https. As we have not yet fully setup PKI authentication from Kibana to Elasticsearch, authentication must initially be done with the kibana user and password. This can be accomplished with the following lines in the kibana.yml file:
WHAT IS PKI?? Is it for user / pass to be encrypted in a file??
elk@stack:/etc/kibana$ sudo nano /etc/kibana/kibana.yml
elasticsearch.hosts: "https://localhost:9200"
elasticsearch.username: "kibana"
elasticsearch.password: "2UpGDAJrLfd1xgazeqTw"
elasticsearch.ssl.certificateAuthorities: "/etc/kibana/certs/client-ca.cer"
elasticsearch.ssl.verificationMode: certificate
PS: xpack.security.sessionTimeout sets the session duration (in milliseconds). By default, sessions stay active until the browser is closed. When this is set to an explicit timeout, closing the browser still requires the user to log back in to Kibana.
xpack.security.sessionTimeout: 6000 for 6 minutes.
Restart Kibana;
elk@stack:/etc/kibana$ sudo systemctl stop kibana.service
elk@stack:/etc/kibana$ sudo systemctl start kibana.service
You should now have a username and password prompt in Kibana. Log in with the user “elastic” and the random password generated above.
Go to Management > Security > Users > “Create user” Make it a superuser, ‘Johnson’, and use this one for login further on.
Configure Logstash to authenticate to Elasticsearch
Now that we have made communication with Elasticsearch encrypted, we are no longer receiving logs from Logstash. So we’ll have to make sure logstash is working as well.
Use the the Management > Roles UI in Kibana or the role API to create a logstash_writer Role. For cluster privileges, add manage_index_templates, manage_ilm and monitor. For indices privileges, add write, delete, manage, manage_ilm and create_index. Select both your indicies, netflow* and timealksdf*
Create a logstash_internal User and assign it the logstash_writer Role. You can create users from the Management > Users UI in Kibana
Configure Logstash to authenticate as the logstash_internal user you just created. You configure credentials separately for each of the Elasticsearch plugins in your Logstash .conf file(s). For example:
input {
  elasticsearch {
    ...
    user => logstash_internal
    password => x-pack-test-password
  }
}
filter {
  elasticsearch {
    ...
    user => logstash_internal
    password => x-pack-test-password
  }
}
output {
  elasticsearch {
    ...
    user => logstash_internal
    password => x-pack-test-password
  }
}
Generate certificates
Also, for logstash pipeline output to elasticsearch, what should we put in for cacert =>? You need to set the CA cert file that you have created with certutil. However, Elasticsearch output Logstash plugin doesn’t support PKCS#12 format so you would need to export the CA certificate in PEM format as such :
openssl pkcs12 -in elastic-stack-ca.p12 -clcerts -nokeys -chain -out ca.pem and use that as the value of cacert (ca.pem).
elk@stack:/etc/kibana/certs$ cd /etc/logstash/conf.d/
elk@stack:/etc/logstash/conf.d$ sudo mkdir certs
elk@stack:/etc/logstash/conf.d$ cd /usr/share/elasticsearc
elkeson@stack:/usr/share/elasticsearch$ sudo openssl pkcs12 -in elastic-stack-ca.p12 -clcerts -nokeys -chain -out ca.pem
elkeson@stack:/usr/share/elasticsearch$ sudo cp ca.pem /etc/logstash/conf.d/certs/ca.pem
elkeson@stack:/etc/logstash/conf.d/certs$ sudo chmod 644 /etc/logstash/conf.d/certs/ca.pem
PEM (??)
elk@stack:/etc/logstash/conf.d/certs$ sudo /usr/share/elasticsearchbin/elasticsearch-certutil cert --ca elastic-stack-ca.p12 -name "CN=localhost,OU=Space Adventure,DC=cobra,DC=com" -pem
[PRESS ENTER]
client
sudo apt-get install unzip
unzip client.zip
Configure outputs
Our outputs;
elk@stack:/etc/logstash/conf.d/certs$ sudo nano 30-outputs.conf
elk@stack:/etc/logstash/conf.d/certs$ sudo nano netflow.conf
Change hosts => ["http://localhost:9200"] to hosts => ["https://localhost:9200"] and add:
                ssl => true
                cacert => '/etc/logstash/conf.d/certs/client-ca.crt'
So our outputs will look like this:
elk@stack:/etc/logstash/conf.d$ more 30-outputs.conf
output {
        elasticsearch {
                hosts => ["https://localhost:9200"]
                ssl => true
                cacert => '/etc/logstash/conf.d/certs/client-ca.crt'
                index => "logstash-%{+YYYY.MM.dd}"
                user => logstash_internal
                password => alsMn43k76guzo
                      }
}
Restart Logstash:
elk@stack:/etc/logstash/conf.d$ sudo systemctl stop logstash.service
elk@stack:/etc/logstash/conf.d$ sudo systemctl start logstash.service
Hopefully, both netflow and logstash are working again in your Dashboards.
root@stack:/usr/share/elasticsearch# bin/elasticsearch-certutil cert --ca \
https://www.elastic.co/blog/getting-started-with-elasticsearch-security Add the xpack.security.enabled: true in elasticsearch.yml
openssl x509 -req -days 365 -in server.csr -signkey server.key -out server.crt

openssl genrsa -des3 -out server.key 2048
openssl rsa -in server.key -out server.key
openssl req -sha256 -new -key server.key -out server.csr -subj '/CN=localhost'
openssl x509 -req -days 365 -in server.csr -signkey server.key -out server.crt
Replace ‘localhost’ with your domain name. Run commands one by one because openssl will prompt you same values for certificate generation.
For further information, go check out the excellent guide here: https://www.elastic.co/guide/en/logstash/current/netflow-module.html
BEATS
Elastic produce a full range of log shippers known as ‘Beats’ which run as lightweight agents on the source devices and transmit data to a destination either running Elasticsearch or Logstash. If you are using Beats you can do this to make Beats use SSL to encrypt the communication between the Beat agent and Logstash:
elk@stack:/etc/ssl$ sudo openssl req -x509 -nodes -newkey rsa:2048 -days 365 -keyout logstash-forwarder.key -out logstash-forwarder.crt -subj /CN=stack.hb.local

sudo openssl pkcs8 -in logstash-forwarder.key  -topk8 -nocrypt -out logstash-forwarder.key.pem

sudo chmod 644 /etc/ssl/logstash-forwarder.key.pem
elk@stack:/etc/logstash$ more pipelines.yml
# This file is where you define your pipelines. You can define multiple.
# For more information on multiple pipelines, see the documentation:
#   https://www.elastic.co/guide/en/logstash/current/multiple-pipelines.html

- pipeline.id: main
  path.config: "/etc/logstash/conf.d/*.conf"
sudo nano /etc/logstash/conf.d/logstash.conf

input {
 beats {
   port => 5044

   # Set to False if you do not SSL
   ssl => true

   # Delete below lines if no SSL is used
   ssl_certificate => "/etc/ssl/logstash-forwarder.crt"
   ssl_key => "/etc/ssl/logstash-forwarder.key.pem"
   }
}
filter {
if [type] == "syslog" {
    grok {
      match => { "message" => "%{SYSLOGLINE}" }
    }

    date {
match => [ "timestamp", "MMM  d HH:mm:ss", "MMM dd HH:mm:ss" ]
}
  }

}
output {
 elasticsearch {
  hosts => localhost
    index => "%{[@metadata][beat]}-%{+YYYY.MM.dd}"
       }
stdout {
    codec => rubydebug
       }
}
Fault finding
netflow.var.kibana.ssl.enabled=false
sudo /usr/share/logstash/bin/logstash --modules netflow --setup -M "netflow.var.kibana.ssl.enabled=false"
The error below is because you have not used SSL:
:/etc/logstash/conf.d$ sudo /usr/share/logstash/bin/logstash --modules netflow --setup
OpenJDK 64-Bit Server VM warning: Option UseConcMarkSweepGC was deprecated in version 9.0 and will likely be removed in a future release.
WARNING: An illegal reflective access operation has occurred
WARNING: Illegal reflective access by com.headius.backport9.modules.Modules (file:/usr/share/logstash/logstash-core/lib/jars/jruby-complete-9.2.11.1.jar) to method sun.nio.ch.NativeThread.signal(long)
WARNING: Please consider reporting this to the maintainers of com.headius.backport9.modules.Modules
WARNING: Use --illegal-access=warn to enable warnings of further illegal reflective access operations
WARNING: All illegal access operations will be denied in a future release
WARNING: Could not find logstash.yml which is typically located in $LS_HOME/config or /etc/logstash. You can specify the path using --path.settings. Continuing using the defaults
Could not find log4j2 configuration at path /usr/share/logstash/config/log4j2.properties. Using default config which logs errors to the console
[WARN ] 2020-08-28 00:57:48.385 [LogStash::Runner] multilocal - Ignoring the 'pipelines.yml' file because modules or command line options are specified
[INFO ] 2020-08-28 00:57:48.393 [LogStash::Runner] runner - Starting Logstash {"logstash.version"=>"7.8.1", "jruby.version"=>"jruby 9.2.11.1 (2.5.7) 2020-03-25 b1f55b1a40 OpenJDK 64-Bit Server VM 11.0.8+10-post-Ubuntu-0ubuntu120.04 on 11.0.8+10-post-Ubuntu-0ubuntu120.04 +indy +jit [linux-x86_64]"}
[INFO ] 2020-08-28 00:57:49.087 [Agent thread] modulescommon - Setting up the netflow module
[ERROR] 2020-08-28 00:57:49.691 [Agent thread] kibanaclient - Error when executing Kibana client request {:error=>#<Manticore::UnknownException: Unsupported or unrecognized SSL message>}
[ERROR] 2020-08-28 00:57:49.811 [Agent thread] kibanaclient - Error when executing Kibana client request {:error=>#<Manticore::UnknownException: Unsupported or unrecognized SSL message>}
[WARN ] 2020-08-28 00:57:49.858 [Agent thread] logstashconfig - The Netflow module has been deprecated in favor of the Beats Netflow module and may be removed in a future release. Learn more about the Beats Netflow module at https://www.elastic.co/guide/en/beats/filebeat/master/filebeat-module-netflow.html
[ERROR] 2020-08-28 00:57:49.884 [Agent thread] sourceloader - Could not fetch all the sources {:exception=>LogStash::ConfigLoadingError, :message=>"Failed to import module configurations to Elasticsearch and/or Kibana. Module: netflow has Elasticsearch hosts: [\"localhost:9200\"] and Kibana hosts: [\"localhost:5601\"]", :backtrace=>["/usr/share/logstash/logstash-core/lib/logstash/config/modules_common.rb:124:in `block in pipeline_configs'", "org/jruby/RubyArray.java:1809:in `each'", "/usr/share/logstash/logstash-core/lib/logstash/config/modules_common.rb:70:in `pipeline_configs'", "/usr/share/logstash/logstash-core/lib/logstash/config/source/modules.rb:30:in `pipeline_configs'", "/usr/share/logstash/logstash-core/lib/logstash/config/source_loader.rb:77:in `block in fetch'", "org/jruby/RubyArray.java:2572:in `collect'", "/usr/share/logstash/logstash-core/lib/logstash/config/source_loader.rb:76:in `fetch'", "/usr/share/logstash/logstash-core/lib/logstash/agent.rb:177:in `converge_state_and_update'", "/usr/share/logstash/logstash-core/lib/logstash/agent.rb:113:in `execute'", "/usr/share/logstash/logstash-core/lib/logstash/runner.rb:395:in `block in execute'", "/usr/share/logstash/vendor/bundle/jruby/2.5.0/gems/stud-0.0.23/lib/stud/task.rb:24:in `block in initialize'"]}
[ERROR] 2020-08-28 00:57:49.890 [Agent thread] agent - An exception happened when converging configuration {:exception=>RuntimeError, :message=>"Could not fetch the configuration, message: Failed to import module configurations to Elasticsearch and/or Kibana. Module: netflow has Elasticsearch hosts: [\"localhost:9200\"] and Kibana hosts: [\"localhost:5601\"]"}
[INFO ] 2020-08-28 00:57:50.207 [Api Webserver] agent - Successfully started Logstash API endpoint {:port=>9600}
[INFO ] 2020-08-28 00:57:55.083 [LogStash::Runner] runner - Logstash shut down.
(…) More should come
Update
Increasing JVM heap size
You should always set the min and max JVM heap size to the same value. For example, to set the heap to 4 GB, set:
-Xms4g -Xmx4g
See https://www.elastic.co/guide/en/elasticsearch/reference/current/heap-size.html for more information
elk@stack:~$ sudo -u elasticsearch -H -s
elasticsearch@stack:/home/elk$ nano /etc/elasticsearch/jvm.options
Yellow cluster
http://chrissimpson.co.uk/elasticsearch-yellow-cluster-status-explained.html
Safari Can’t Open the Page
When trying to export Netflow data, in Safari, you’ll get an error “Safari can’t open the page “blob:https:// (…) WebKitBlobResource error 1.)” – just use Google Chrome.
Certificates
lk@stack:/usr/share/elasticsearch$ sudo bin/elasticsearch-certutil cert -out certs/elastic-certificates.p12 -pass ""
Version control
To see which version of logstash you have installed are, run:
elk@stack:~$ sudo /usr/share/logstash/bin/logstash --version
logstash 7.6.0
elk@stack:~$ su -i
Elasticsearch:
elk@stack:/usr/share/elasticsearch/bin$ sudo ./elasticsearch --version
OpenJDK 64-Bit Server VM warning: Option UseConcMarkSweepGC was deprecated in version 9.0 and will likely be removed in a future release.
Version: 7.6.2, Build: default/deb/ef48eb35cf30adf4db14086e8aabd07ef6fb113f/2020-03-26T06:34:37.794943Z, JVM: 13.0.2
Kibana:
elk@hstack:/usr/share/kibana/bin$ ./kibana --version
7.6.2
Read-only index
If suddenly Kibana stops showing input from Elasticsearch in your graphs, check your logstash-plain.log file.
In your logstash-plain.log file, it might show:
elk@stack:~$ tail -f /var/log/logstash/logstash-plain.log
[2019-03-25T03:25:24,837][INFO ][logstash.outputs.elasticsearch] retrying failed action with response code: 403 ({"type"=>"cluster_block_exception", "reason"=>"index [netflow-2018.11.01] blocked by: [FORBIDDEN/12/index read-only / allow delete (api)];"})
And in Kibana, go to Management > Index Management and look for “1 Index has lifecycle errors” and press ‘Show errors’.
.. And if ilm.step:ERROR shows, on for example index logstash-2019.07.27-000001, go to terminal and make it explain itself (Johnson is the name of my superuser, which is a user you should have created earlier):
elk@stack:~$curl -u Johnson:Password -X GET "https://localhost:9200/logstash/_ilm/explain?pretty" -k
(...)
     "failed_step" : "check-rollover-ready",
The error, check-rollover-ready, appears after your index is locked and changes to read only. Reason for that is because of not enough storage on your machine hard drive. So, delete some files, delete some indexes - free up your space.
Go to Management > Index Lifecycle Policies and select logstash-policy. Make sure Enable rollover is selected and reduse your Maximum index size [from 50GB to 4GB or something equivalent]. Save policy.
Go to Dev Tools on the left side of the menubar, select Console and insert on the left side:
PUT logstash/_settings
{
 "index": {
   "blocks": {
     "read_only_allow_delete": "false"
    }
  }
}
Press the play button.
On the right side, it should say:
{
  "acknowledged" : true
}
Then verify from logstash-plain.log that it is able to send logs again (you might have to do it with all of your indexes, e.g. PUT netflow-*/_settings).
Index Management and select logstash and then press Manage index > Retry Lifecycle cycle.
Logstash with just Netflow
If you are not using syslogs, doing the grok patterns and everything above, do this to quick and dirty populate netflow in your Kibana:
Stop logstash. Start with --modules netflow --setup. Wait a minute. Or two. Grab a cup of coffee. Stop logstash.
Edit logstash.yml:
elk@stack:/usr/share/logstash$ sudo nano /etc/logstash/logstash.yml

(...)
modules:
   - name: netflow
     var.input.udp.port: 2055
     var.elasticsearch.hosts: http://127.0.0.1:9200
     var.elasticsearch.ssl.enabled: false
     var.kibana.host: 127.0.0.1:5601
     var.kibana.scheme: http
     var.kibana.ssl.enabled: false
     var.kibana.ssl.verification_mode: disable
Start with sudo systemctl start logstash.service
Authors
Mr. Johnson
Acknowledgments
- http://pfelk.3ilson.com
- https://arnaudloos.com/2019/enable-x-pack-security/
- https://www.elastic.co/elk-stack
- https://extelligenceblog.it/2017/10/18/elasticstack-elk-and-pfsense-firewall-ip-traffic-statistics-with-netflow/
- https://help.ubuntu.com/lts/serverguide/certificates-and-security.html
- https://github.com/solvaholic/solvaholic.github.io/wiki/Netflow-with-pfSense-and-ELK
- https://www.elastic.co/elk-stack
- https://github.com/patrickjennings/logstash-pfsense
- https://www.itzgeek.com/how-tos/linux/ubuntu-how-tos/how-to-install-elasticsearch-logstash-and-kibana-elk-stack-on-ubuntu-18-04-ubuntu-16-04.html
- https://logz.io/blog/elk-stack-raspberry-pi/
- http://extelligenceblog.it/2017/07/11/elastic-stack-suricata-idps-and-pfsense-firewall-part-1/
- https://forum.netgate.com/topic/107735/elk-pfsense-2-3-working/2
- https://vitux.com/how-to-setup-java_home-path-in-ubuntu/
- http://secretwafflelabs.com/2015/11/06/pfsense-elk/
- https://www.elastic.co/guide/en/logstash/current/plugins-filters-grok.html#plugins-filters-grok-patterns_dir
- https://www.elastic.co/blog/elasticsearch-security-configure-tls-ssl-pki-authentication
- https://www.elastic.co/blog/getting-started-with-elasticsearch-security
- https://www.elastic.co/guide/en/logstash/7.2/ls-security.html
- https://discuss.elastic.co/t/using-logstash-elasticsearch-output-over-https/51319
- https://discuss.elastic.co/t/certificates-and-keys-for-kibana-and-logstash-with-x-pack/150390/2
- https://www.elastic.co/guide/en/elasticsearch/reference/6.5/disk-allocator.html
- https://stackoverflow.com/questions/54027888/forbidden-12-index-read-only-allow-delete-api-problem
- https://github.com/elastic/kibana/issues/13685